Site Utilization by Service Provider
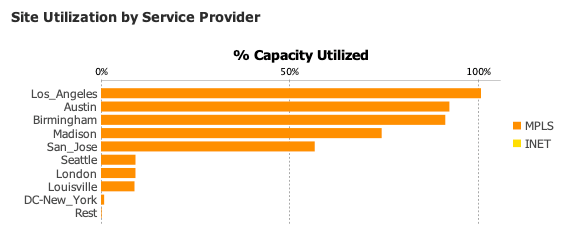
Site Utilization by Service Provider charts the capacity of each site, based on the service provider. The capacity is charted in a stacked bar chart format, color-coded to indicate the service providers associated to that site’s interfaces. Sites are device level attributes, while capacities and service providers are interface level attributes that are user-defined in the device/interface tree view.
There are three charts in the Application Group section of the PfRv3 Dashboard: Top 10 Alerts by Application Group, Application Group Bandwidth by Site and Application Group Bandwidth by Service Provider.